#inverted hammer pattern
Explore tagged Tumblr posts
Visit Tumblr Blog
Explore Tumblr blogs with no restrictions, modern design and the best experience.
Last Seen Tumblr Blogs


Fun Fact
12.7% of mobile users access Tumblr.
Text
Shooting Star Candlestick Pattern | How to Trade Using Shooting Star
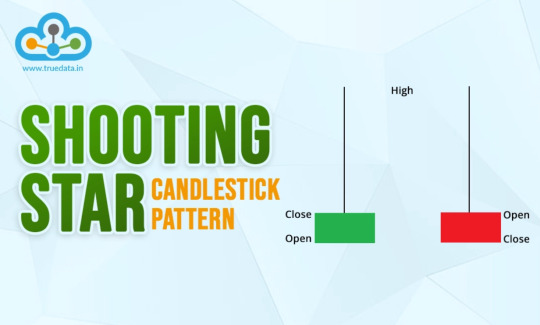
The Shooting Star pattern is a useful candlestick signal for identifying potential trend reversals from bullish to bearish after an uptrend.It has a classic small body with a long upper wick and can be misunderstood easily for the Inverted Hammer pattern.
Read Full Blog: Shooting Star Candlestick Pattern
#shooting star candlestick pattern#how to trade shooting star pattern#how to identify shooting star#shooting star vs inverted hammer pattern
0 notes
Text
Understanding the Inverted Hammer Candlestick Pattern: A Trader's Guide
Title: Understanding the Inverted Hammer Candlestick Pattern: A Trader’s Guide Introduction: Candlestick patterns are powerful tools that traders use to analyze price movements in financial markets. One such pattern that often signals potential reversals is the inverted hammer. In this blog post, we will delve into what an inverted hammer is, how it works, and how traders can use it to make…
View On WordPress
#bullish reversal#candlestick pattern#Inverted Hammer#Risk Management#technical analysis#Trend Reversal
0 notes
Text
Hammer Pattern
The “Hammer” pattern is a significant candlestick pattern in technical analysis that traders use to identify potential reversals in price trends. It is a bullish reversal pattern that forms after a downtrend and signals a potential trend reversal to the upside. The Hammer pattern is characterized by a single candle with a small body and a long lower shadow. Here are the key components of the…

View On WordPress
#bearish#bullish#candlestick patterns#Candlesticks#learn technical analysis#Patterns#stock markets#stock trading#successful trading#technical analysis#what is a hammer pattern#what is inverted hammer
0 notes
Text
《Black Sheep & Hound》
*(A super short snippet, so I went ahead and translated it.)*
**Setting:**
An inverted version of Jason and Jaime (think Earth-3 vibes) — **Scarlet Scarab** (???) and **Blue Hood** (???).
Too lazy to elaborate, but in short:
- This Jaime was originally Owlman ‘s lackey, but when Tim (Earth-3 version)went rogue, Owlman sent Jaime to "befriend" him (read: spy on him).
- Tim formed his own bad Teen Titans team, while Jaime played both sides as a double agent—secretly plotting to kill both masters and crown himself king.
- He seduced resurrected Jason to psychologically wreck Owlman (who, despite being a nihilist, still cared about family early on). Jaime weaponized Jason’s hatred for Tim beautifully
I’ve had this Jaime brewing forever, but Jason’s still half-baked. What can I say? I love writing seemingly unhinged stuff. 🙌
———
Fire.
The same fire as that night, devouring the sky whole, searing into Jason’s world. Every evening, it reminds him—the taste of ash is so—
Cold
Like a corpse.
His corpse
Jason kneels, dazed. The fabric over his abdomen is charred; his cheeks streaked with soot. The inferno ahead dyes his eyes crimson. The explosion ruined nearly everything—including Jaime’s plans. Debris collapses in the flames, surging like tidal waves, hammering against Jason’s memories.
Footsteps approach through the smoke. Jaime—still in that ridiculous patterned red suit, now scorched and frayed. His hair is wild on one side; his mouth smeared with lipstick (or blood?), painting a quarter of his face red.
Staggering forward, he mutters to himself. When he reaches Jason, he drops to his knees, cradles Jason’s face, and stares
“Jason ,Jason,my dear.
Do you know how hard to murder your genius brother?”
His grip on Jason’s face tightened. He was already insane, but now he looked *deranged*—that kind of madness, his red mouth looking just like... like him。
Jason’s breathing accelerated wildly, his heart hammering like an engine. Everything was dragging him back to that night, the night of his death, pulling him toward hell. As if he was born to die, burn to die.
“Jason?"
Jaime’s grip loosened, his voice laced with confusion as his hands gently traced the grime on Jason’s face. But Jason knew—Jaime had found the scar on his left cheek.
That *"J."* That scar.
“Jason? Darling, look at me."
Jason couldn’t. He was suffocating.
“Look at me."Jaime’s voice softened. “Jason."
He pulled Jason into his embrace, one arm around his shoulders, the other cradling the back of his neck. Jason’s gaze remained locked on the flames—he couldn’t look away.
"It’s okay."
*"Feel me, darling. Feel now."
The armor silently crept over Jaime’s hand. Khaji Da injected a mild sedative through micro-needles. Jaime felt Jason’s heartbeat slow, like embers cooling.
*"But why did you do it, sweetheart?"*
*"I was still inside. Did you not care if the bomb took me too?"* Jaime didn’t voice it aloud.
Did he truly want Tim dead? Did he really hate him?
*"Alright, darling."* Jaime cupped Jason’s face again. *"We should go back... Pajarito escaped, but I promise he won’t move too fast. We’ll beat Owlman to the punch—return with a little ‘gift’ for the team."*
Jason's eyes wide, his eyes penetrated Jaime, as if he was looking at a ghost that existed in the past. He was bathed in fire ,extinguished in anger and sadness.
*"Jason,"* Jaime whispered.
Then he kissed him.
When he pulled away, his mouth was full of blood.
And then—he laughed. A wild, hysterical cackle, so violent it choked him, blood streaming from his nose.
*Oh god. Oh god.*
He’d bitten off his tongue.
*"HAHAHAHAHAHAHAHAHAHAHAHAHAHAHAHAHAHA—"*
*"KHAJI!"* Jaime screamed in his mind. *"KHAJI! GOD! MY ‘BOYFRIEND’ JUST BIT OFF MY TONGUE HAHAHAHAHAHA, HE BIT OFF MY TONGUE!"*
Khaji Da only chuckled softly in response—cold, affectionate. As usual.
——————
Jaime calls tim Pajarito
I have some descriptions of the characters of khaji da and Jaime in “圣诞颂歌”
My anxiety disorder is better, but I started to write by personally xp.
6 notes
·
View notes
Text
Inverted hammer is single candlestick pattern.. we will be looking for buy , only after confirmation candle.
For more join us and learn more :
#forex#forex education#forex expert advisor#forexmentor#forex broker#forex indicators#forex market#forexsignals#forexmastery#crypto#mony mony#make mony online#make money online#money#earn money online#wealth#smart money habits#global market#market strategy#market analysis
4 notes
·
View notes
Text
Hammer Candlestick: Make Reversal Opportunities
In the world of technical analysis, identifying potential market reversals is important for traders seeking to maximize their profits and minimize their losses. One of the most reliable patterns for spotting these reversals is candlestick patterns, especially hammer candlestick
What Is a Hammer Candlestick?
A hammer candlestick pattern is a specific type of candlestick pattern used in technical analysis to indicate a potential reversal in a downtrend. It appears at the bottom of a downward trend and is characterized by a small body at the upper end of the trading range with a long lower shadow. The length of the lower shadow is at least twice the length of the body. This pattern suggests that despite the sellers pushing prices down significantly during the trading period, strong buying pressure drove the prices back up near the opening price by the end of the period, indicating a possible reversal to the upside.
Types of Hammer Candlestick
Hammer Candlestick The hammer candlestick pattern appears at the bottom of a downtrend and is characterized by a small body with a long lower shadow and little to no upper shadow. The lower shadow should be at least twice the length of the body.
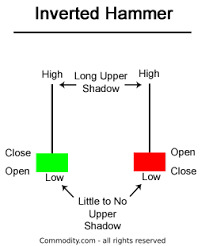
Inverted Hammer Candlestick The inverted hammer candlestick pattern also appears at the bottom of a downtrend but is characterized by a small body with a long upper shadow and little to no lower shadow. The upper shadow should be at least twice the length of the body.
Limitations of Hammer Candlestick
Confirmation Required: A hammer candlestick alone does not guarantee a trend reversal. Subsequent bullish price action is needed to validate it.
No Price Target: The pattern does not provide a specific price target for the potential reversal, requiring other tools for determining exit points.
Context-Dependent: The hammer pattern is most reliable at the bottom of a downtrend and may not be valid in other market conditions.
False Signals: In highly volatile markets, hammer patterns can occur frequently without indicating a true reversal.
Additional Indicators Needs: It will be more effective with other technical analysis tools, rather than relying solely on the hammer candlestick.
Learn more: https://finxpdx.com/hammer-candlestick-how-to-spot-reversal-opportunities/

5 notes
·
View notes
Text
Inverted Hammer Pattern Explained: Spot Market Reversals Like a Pro
Are you spotting the right reversal signals in the market?
Understanding candlestick patterns can provide a critical edge in trading, especially when it comes to identifying potential trend reversals. One such pattern is the Inverted Hammer—a powerful single-candle formation that often signals a possible shift from bearish to bullish momentum. However, recognizing it isn’t enough. Traders must understand the psychology behind the candle, its context within a trend, and how to confirm its validity with other indicators.
In our latest article, we break down the Inverted Hammer Pattern in detail: how to spot it, what it really means, and how to use it effectively in your trading strategy.
Start making smarter trading decisions today.
Read the full guide here:
#CandlestickPatterns#TradingForBeginners#InvertedHammer#StockMarket#TechnicalAnalysis#PriceAction#SmartTrading
0 notes
Text
Inverted Hammer

Have you already started using technical analysis? If so, one pattern you should familiarize yourself with is the inverted hammer. This is a great tool that you can use to try to detect market reversals. But like all indicators, it has its own challenges. For the Inverted Hammer pattern to work, you need to use it correctly.
0 notes
Text

Top Bullish Reversal Candle Patterns
READ BLOG - CLICK HERE
Morning Star
Bullish Engulfing
Hammer
Inverted Hammer
Double Bottom
0 notes
Text
How Many Candlestick Patterns Are There

How Many Candlestick Patterns Are There? A Friendly Guide to Understanding the Basics
Understanding the world of trading can feel like learning a new language. And if you’ve ever seen a candlestick chart, you might’ve wondered, “What am I even looking at?” Don’t worry—you're not alone! Whether you're someone just getting into trading or simply curious about how it all works, this article will walk you through the mysterious world of candlestick patterns. We’ll break it down in a way that makes sense, no financial dictionary required.
Imagine candlestick patterns like traffic signals on the road of trading—they give hints about what might happen next. Some say, “Hey, the market might go up!” Others hint, “Watch out, things could go south.” So, how many candlestick patterns are there? Great question—let’s find out.
Learn how many candlestick patterns are there, different types of candlestick patterns, and what is candlestick patterns in simple language for beginners.
Introduction to Candlestick Patterns
Let’s start at the beginning. If you’ve ever seen a stock or cryptocurrency chart, you’ve probably noticed those little red and green rectangles—they're called candlesticks. They're not just colorful bars; they tell a story about price movement.
What is Candlestick Patterns?
Candlestick patterns are specific formations of these candles on a chart. Think of them as facial expressions of the market. Just like a smile can tell you someone’s happy, a certain pattern in candles can suggest whether the market is feeling bullish (going up) or bearish (going down).
Each candlestick gives four main pieces of information:
Open Price
Close Price
High Price
Low Price
Why Are Candlestick Patterns Important?
Imagine driving with your eyes closed. Sounds scary, right? That’s what trading without understanding patterns is like. Candlestick patterns act like headlights—they help traders see where the road might lead. While they don't guarantee success, they give valuable clues that many traders use to make decisions.
How Many Candlestick Patterns Are There?
Here’s the big question: how many candlestick patterns are there? Well, in total, there are more than 50 recognized patterns, but most traders focus on about 30 key ones. These patterns are grouped into:
Single Candlestick Patterns
Double Candlestick Patterns
Triple Candlestick Patterns
Each category offers insight into different possible future movements of the market.
Types of Candlestick Patterns
To make things easier, let’s break them down:
Single Candlestick Patterns
These involve just one candlestick. They're quick and simple.
Double Candlestick Patterns
These involve two candles and often signal a trend reversal.
Triple Candlestick Patterns
These use three candles to tell a more complete story about what the market might do next.
Let’s dig deeper into each one.
Single Candlestick Patterns
These are the building blocks of chart reading. They’re easy to spot and understand.
Doji
A Doji looks like a cross. It happens when the open and close prices are almost the same. It shows market indecision—like the market saying, “I’m not sure which way to go.”
Hammer
A Hammer looks like—you guessed it—a hammer! It has a small body with a long lower wick. It usually shows up at the bottom of a downtrend, signaling a potential reversal upward.
Inverted Hammer
Similar to the Hammer, but flipped upside down. It also signals a possible trend reversal, but needs confirmation from the next candles.
Double Candlestick Patterns
These patterns give a stronger message since they involve two candles working together.
Bullish Engulfing
This happens when a small red candle is followed by a big green candle that completely “engulfs” it. It signals a potential move upward.
Bearish Engulfing
The opposite of bullish. A small green candle is followed by a larger red one. This can signal a downward move ahead.
Tweezer Tops and Bottoms
These are two candles with matching highs (tops) or lows (bottoms). They can suggest that a trend is losing strength.
Triple Candlestick Patterns
When three candles join forces, the pattern becomes even stronger and more reliable.
Morning Star
This is a bullish reversal pattern made of three candles: a bearish candle, a small-bodied candle (which can be a Doji), and a bullish candle. It's like a sunrise—things are looking up!
Evening Star
The opposite of Morning Star. It begins with a bullish candle, followed by a small one, and ends with a bearish candle. It's a sign the sun is setting on an uptrend.
Three White Soldiers
This pattern consists of three strong green candles in a row. It’s a very bullish sign, showing continued buying pressure.
Three Black Crows
You guessed it—this one's bearish. It’s made of three long red candles in a row, suggesting strong selling pressure.
Common Mistakes When Reading Patterns
Let’s face it, we all mess up sometimes. Here are some pitfalls to avoid:
Relying on patterns alone: Always use other tools too.
Ignoring the bigger trend: A bullish pattern in a strong downtrend may not hold up.
Overtrading: Just because you see a pattern doesn’t mean you must act on it.
Tips for Learning Candlestick Patterns
Learning candlestick patterns is like learning to read emotions. Start small:
Practice with paper trading.
Use flashcards to memorize patterns.
Review historical charts to see how patterns played out.
Keep a trading journal to track your learning.
Conclusion
So, how many candlestick patterns are there? There are over 50—but don’t panic! You really only need to master about 30 core patterns to start making smarter decisions. Whether you’re an aspiring trader or just a curious learner, understanding these patterns is like having a window into the market’s soul.
Remember, candlestick patterns are tools—not magic tricks. Use them wisely, and always double-check with other indicators and research.
FAQs
How many candlestick patterns are there?
There are over 50 recognized candlestick patterns, but traders mostly use 30 key ones regularly.
What is candlestick patterns in simple terms?
They are visual representations of price movements in a chart. Each pattern gives clues about where the market might go next.
Are candlestick patterns accurate?
They can be helpful, but no pattern is 100% accurate. They're best used with other tools and indicators.
Can beginners learn candlestick patterns easily?
Absolutely! With practice, even beginners can understand and use them to make better trading choices.
What's the difference between bullish and bearish patterns?
Bullish patterns suggest prices may rise, while bearish patterns indicate a possible decline in prices.
#how many candlestick patterns are there#what is candlestick patterns#how to read candlestick pattern#types of candlestick patterns
1 note
·
View note
Link
#BullishReversal#candlestickpatterns#chartpatterns#ForexTrading#HammerCandlestick#InvertedHammer#MarketSentiment#priceaction#riskmanagement#StockMarket#supportandresistance#technicalanalysis#TradingSignals#TradingStrategy#TrendReversal
0 notes
Text
Ethereum Price Targets $6K as Crypto Community Gears up for Expected Altseason
Key Points
Ethereum’s price is predicted to reach $6K in the coming months due to a potential bullish breakout.
Bitcoin’s rising dominance in the crypto market could lead to a bullish rebound for altcoins in early 2025.
After Bitcoin’s price fell below $70k due to strong resistance around its all-time high, Ethereum’s price maintained a short-term bearish outlook.
Ethereum, a leading altcoin with a market cap of over $296 billion and a daily average traded volume of around $14.5 billion, ended last week with an inverted hammer.
Ethereum’s Potential Bull Run
Ethereum’s price retested a crucial support level above $2,400, which could be the foundation for the next major bull run. According to crypto analyst Ali Martinez, Ethereum’s price is poised to rally towards a new all-time high (ATH), with a target of about $6K in the coming months.
Martinez points out that Ethereum’s price has been on a rising trend since early 2023. From a technical analysis standpoint, Ethereum’s price has respected a rising logarithmic trend, suggesting a possible bullish breakout.
Ethereum’s price has been consolidating in a symmetrical triangular pattern, which often results in a bullish breakout, since the crypto crash on August 5. If Ethereum consistently closes below the support range between $2,150 and $2,293, the bullish narrative for Ethereum’s price will be invalidated.
The Anticipated Altseason
In recent years, the Ethereum market has continued to lose ground to Bitcoin, as evidenced by Bitcoin’s increasing dominance. Latest market data shows Bitcoin’s dominance in the crypto market has risen to about 60 percent while Ethereum’s has dropped to about 13.19 percent.
As a result, the ETH/BTC pair has been in a multi-year falling trend, despite the weekly Relative Strength Index (RSI) being in the oversold area. Crypto analyst Benjamin Cowen suggests that another altcoin correction is likely in the coming weeks before a bullish rebound in early 2025.
Cowen predicts that the Bitcoin market will continue to outperform the altcoin space in the short term before a reversal in the first half of 2025. He has set a target range of between $1,000 and $1,400 for Ethereum in November and December before a spike beyond $6K in 2025.
Market Overview
Demand for Ethereum and most altcoins remains relatively low due to short-term market uncertainties. Last week, US spot Ether ETF issuers reported a net cash inflow of around $13 million, while Bitcoin’s ETFs registered over $2.2 billion in the past seven days.
The Ethereum ecosystem has faced stiff competition from other layer-one networks, led by Solana. Despite this, the Ethereum network remains the undisputed leader in web3, with over $45 billion in total value locked (TVL) and around $84 billion in stablecoins market cap.
0 notes
Text
BOTT Price Action Guide: Binary Options Turbo Trading, Forex, FX Options, Digital Options BOTT Price Action Guide: Binary Options Turbo Trading, Forex, FX Options, Digital OptionsThe ultimative Price Action guide (7 edition) for any kind of financial instrument (Binary Options, Forex, FX Options, Digital Options) any kind of time frame from 1 min over 5 min up to 15 min, 30 min and above and any kind of broker. This ebook is all you need, especially as a binary option turbo trader or Forex day trader to get profit out of the market, to get out of debt, make yourself a living or help your friends and family and to archieve financial freedom. Don't miss the opportunity to get this ultimative Price Action guide (7 edition)File Size: 12597 KBPrint Length: 118 pagesPublisher: BO Turbo Trader; 7 edition (October 24, 2018)Publication Date: October 24, 2018Content:Mindset for consistent profits- Practice- Win Rate- Discipline- Money Management- Emotions Candlestick Patterns- Hammer, Inverted Hammer, Takuri Line, Shooting Star and Hanging man- Dragonfly Doji, Gravestone Doji- spinning top - long-legged doji, high wave and rickshaw man- Pinbar - Pin Bar - Pinocchio bar or Kangaroo Tail - Tweezer Top and Tweezer Bottom- bearish harami, bullish harami and bullish harami cross and bearish harami cross- three inside down, three inside up- descending hawk and homing pigeon- bearish meeting line - counterattack line and bullish meeting line- bearish belt hold - black opening shaven head - black opening marubozu- bullish belt hold - white opening shaven bottom - white opening marubozu- bearish kicker signal - bullish kicker signal- matching high and matching low- bearish stick sandwich and bullish stick sandwich - bearish breakaway and bullish breakaway- ladder top and ladder bottom - tower top and tower bottom- three stars in the north and three stars in the south- bearish sash pattern and bullish sash pattern- engulfing candlestick pattern or the big shadow pattern- (bearish) dark cloud cover and (bullish) piercing line- Breakaway gap, exhaustion gab, continuation gap and common gaps- rising window and falling window- marubozu and big belt- inside bar and mother bar- evening star, morning star and evening doji star and morning doji star- three white soldiers and three black crowsChart Patterns- Double Top - M Formation - Mammies and Double Bottom - W Formation - Wollahs- J-Hook pattern and inverted J-Hook candlestick pattern- bearish last kiss - bearish pullback and bullish last kiss and bullish breakout- Head and Shoulders and inverted Head and Shoulders Pattern- Trend Channel - uptrend and downtrend- symmetrical triangle- ascending triangle and descending triangle- bullish flag and bearish flag - bullish pennant and bearish pennant - rising wedge and falling wedge- Broadening Bottoms and Broadening Tops- Rectangle Bottoms and Rectangle TopsConcepts- Candlestick Mathematics- Rejection - market move - weak snr and strong snr- trending and ranging market- minor and major trend- adapting forex strategies to binary options turbo trading- proper rejection - invalid rejection- false breakouts - channel breakouts- reversal and retracements- highest probability trading setups- high probability techniques- market pressures and types of market pressures- upper shadow and lower wick or tail- advanced candlestick charting techniques- overbought and oversold - oscilator - RSI CCI Stochastic Oscilator- different market conditions and market conditions examples- cycle of market emotions, psychology and dynamics- trading setups without rejections as confirmation - multiple time frame trading concept, system, methology and strategy- candlestick momenting- direction of candlestick momentum- inside swing and outside swing- support and resistance - minor snr and major snr and much more concepts ... Also by the same author: BOTT Mentorship Self-Study Video Pack 1-4 BOTT Price Action Indicator BOTT Price Action Bible by BO Turbo Trader
0 notes
Text
0 notes
Text
35 Powerful Candlestick Patterns
As you step in the world of forex, there is an essential indicator that traders should know. With our 35 powerful candlestick pattern guide, it can enhance you to make effective decision while trading.
Here are examples of powerful candlestick patterns:
Hammer The hammer is an important candlestick shape often seen when prices are falling. It looks like a hammer with a small top and a long lower stick. This happens when sellers bring the price down, but strong buying forces push it back up to close almost where it started. This leaves a candle that has a small body and a long bottom stick, which makes it look like a “hammer.”
Bullish Engulfing Bar The bullish engulfing bar is a key pattern with two candles, usually appearing when a downtrend is about to end. It starts with a smaller candle showing a drop in price, followed by a bigger candle that fully covers the first one from its opening to closing prices.
Piercing Pattern The piercing pattern is a sign that prices might start going up, usually showing up when they’ve been falling. It has two candles: the first one shows a drop in prices and is followed by one that starts even lower but goes up past the middle of the first candle.
Three White Soldiers The three white soldiers is a pattern of three long candles going up in price, often seen as a strong clue that a downward trend could be flipping. Each of these candles starts within the last one and ends almost at its highest point, with little or no upper stick.
Three Inside Up The three inside up is a pattern of three candles that often hints at prices moving up. It’s seen as a strong clue that the market could be shifting in a positive direction. Here’s how to spot it:
First Candle: This is a long downward candle that usually comes at the end of a period where prices have been falling. It’s like the opening act for a possible change in direction.
Second Candle: This is an upward candle that starts lower than where the first one ended and closes within the first candle. It suggests a turn might be coming but doesn’t confirm it.
Third Candle: This last upward candle starts and ends above the second one, sealing the deal on the upward trend.
6. White Marubozu The White Marubozu is a single candle pattern that’s seen as a strong hint that prices will keep going up. Here’s what you should look for in this pattern:
Color: The candle is green, which means the price ended up higher than where it started.
No Upper or Lower Shadow: Unlike most candles that have either a higher or lower tail, this one doesn’t have any. Both the high and low prices are the same as the start and end prices.
7. Bullish Harami The Bullish Harami is a two-candle pattern that might signal a change from a falling market to a rising one. The first candle is a big one that shows a drop in price, and the second, smaller one shows an increase.
8. Inverted Hammer The inverted hammer is a single-candle pattern that often shows up when a market is going down but could be about to go up. This candle has a small body at the bottom and a long upper wick, with almost no wick at the bottom.
9. Tweezer Bottom The tweezer bottom is a pattern you might see when the market is going down but could be getting ready to go up. It shows up as two candles that line up perfectly at their lowest points. The first candle is generally going down, following the current market trend. The second candle is going up, hinting that things might be about to change.
10. Three Outside Up The three outside up is a pattern that suggests the market might be about to go up. It shows up as three candles on a chart. It consists of three candles:
First Candle: A bearish candle in a prevailing downtrend.
Second Candle: A bullish candle that completely engulfs the first one, signifying that buyers are starting to take control.
Third Candle: Another bullish candle that closes higher than the second, confirming the bullish momentum.
Find more details: Finxpdx
Download PDF file: Candlestick Patterns
#investing#finance#investment#financial#forex#forextrading#forex market#candlestick#candlesticks pattern
0 notes